·6 min read
Recipe Costing System for Restaurants: Know Your Real HPP per Menu Item and Stop Ingredient Leakage
Most F&B owners know their food cost only by feel. Here is how to build digital recipe cards, link them to purchase prices and sales, and spot price hikes, over-portioning, waste and theft before they eat your margin.
- food cost
- recipe costing
- hpp
- f&b
- restaurant
- stock variance
- inventory
- sme
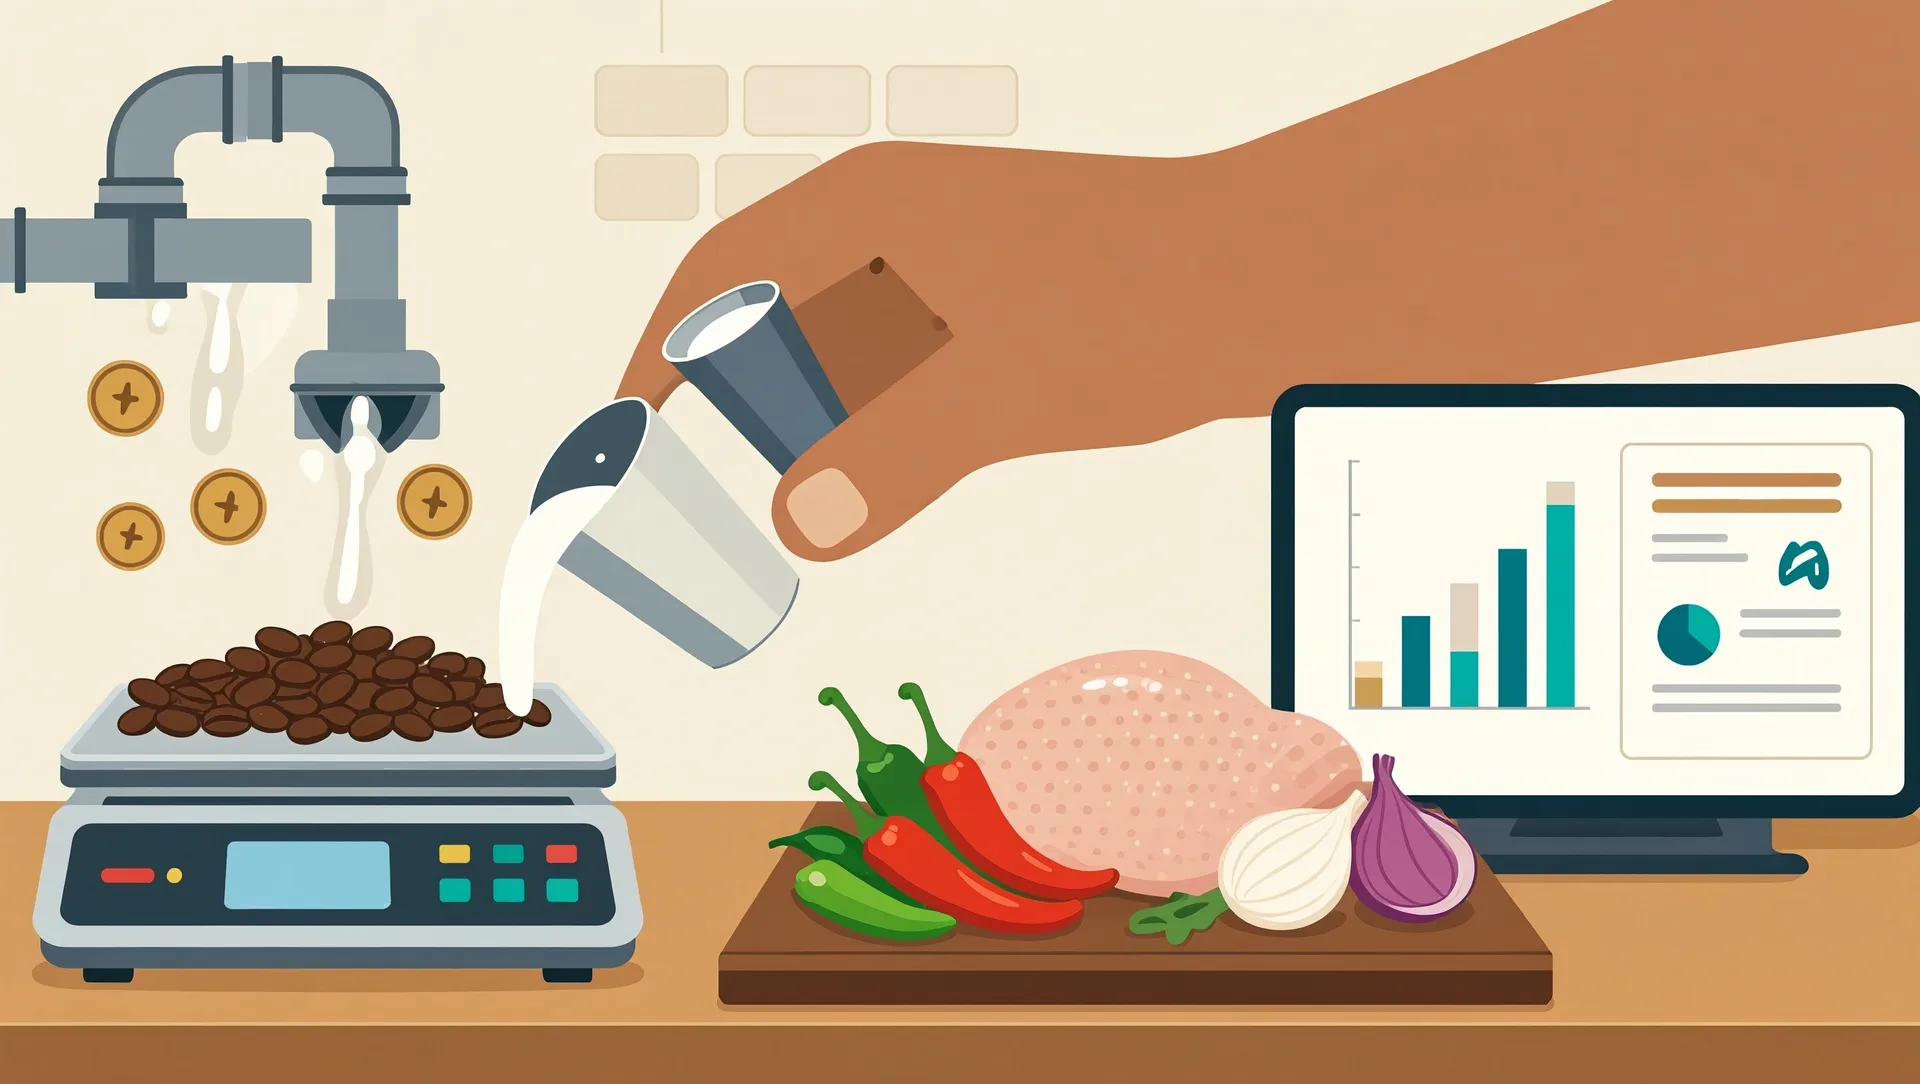
Your café is busy, sales look healthy, yet at the end of the month there is less money left than you expected. In most F&B businesses the cause is not one big problem but many small ones: a supplier who quietly raised prices, a barista who pours a little extra milk, chicken that gets thrown away, or stock that walks out the back door. A recipe costing system for restaurants makes these leaks visible by showing what each menu item should cost and comparing it with what you actually used.
This article walks you through the three building blocks: digital recipe cards, live ingredient prices, and a regular comparison between theoretical and actual usage. You can start with a spreadsheet this week.
What a Recipe Costing System for Restaurants Actually Does
Many owners calculate HPP (cost of goods sold) once, when the menu is launched, and never again. Prices change every month, so that number becomes fiction. A proper system does three things continuously:
- Calculates the cost of every menu item from its ingredients, based on the latest purchase prices.
- Calculates how much of each ingredient you should have used, based on what was sold.
- Compares that with what you really used, based on purchases and stock counts.
The gap between the second and third numbers is your leakage. Without this comparison, waste and theft simply disappear into a general feeling that margins are thin.
Step 1: Build a Digital Recipe Card for Every Menu Item
A recipe card lists every ingredient in one portion, the exact quantity, and the unit cost. Take a simple example, an iced palm sugar coffee selling for Rp 30,000:
- Coffee beans 18 g at Rp 250,000/kg = Rp 4,500
- Fresh milk 150 ml at Rp 20,000/litre = Rp 3,000
- Palm sugar syrup 25 ml at Rp 40,000/litre = Rp 1,000
- Ice = Rp 300
- Cup, lid and straw = Rp 1,800
Total: Rp 10,600, or about 35% food cost. Now you have a real number instead of a guess.
Account for yield, not just purchase weight
Many ingredients lose weight before they reach the plate. A whole chicken bought at Rp 38,000/kg might give you only 70% usable meat after bones and trimming, so the real cost is closer to Rp 54,000/kg. Shallots lose skin, fish loses bones, beef shrinks when cooked. Record a yield percentage for these ingredients, otherwise every dish that uses them is undercosted.
Use sub-recipes for sauces and bases
If your kitchen makes its own sambal, broth or sauce base in batches, cost the batch once as a sub-recipe (for example, 1 kg of sambal costs Rp 45,000) and then use it as a single ingredient in menu items. When chilli prices jump, you update one sub-recipe and every dish that uses the sambal updates automatically.
Write down how it is really made
Weigh portions in your actual kitchen, not the ideal version in the owner's head. If the cook uses 200 g of rice, not 150 g, the card must say 200 g, or you must retrain the cook. Either way, the card should match reality.
Step 2: Link Recipe Cards to Purchase Prices
A recipe card is only useful if the ingredient prices are current. Every time an invoice arrives, the new price should be entered once and flow into all recipes that use that ingredient.
Here is why this matters. If your coffee bean supplier raises the price from Rp 250,000 to Rp 300,000/kg, each cup costs Rp 900 more. At 100 cups a day, that is Rp 90,000 a day, or about Rp 2.7 million a month, gone without anyone noticing. With linked prices, your food cost percentage for that drink moves from 35% to 38% the day the invoice is entered.
Practical tips:
- Decide on one method: last purchase price (simple, reacts fast) or weighted average (smoother, better for accounting). For most small businesses, last price is enough.
- Set an alert, for example when any menu item goes above your target food cost (say 35%) or when an ingredient rises more than 10%.
- Review the top-selling items monthly and decide: renegotiate, switch supplier, adjust portion or raise the price.
Step 3: Compare Theoretical and Actual Ingredient Usage
This is where leakage becomes visible. The calculation is simple:
- Theoretical usage = number of items sold × quantity in the recipe card.
- Actual usage = opening stock + purchases − closing stock.
Example: in one month you sold 2,800 milk-based drinks at 150 ml each. Theoretical milk usage is 420 litres. Your stock records show you actually used 465 litres. The 45-litre gap is worth about Rp 900,000, a variance of roughly 11%.
What causes variance
- Over-portioning: free pouring instead of measuring.
- Waste: expired milk, spoiled vegetables, failed dishes.
- Unrecorded consumption: staff meals, free drinks for friends, tasting.
- Theft: stock taken out without any sale.
- Wrong recipe cards: the card says 150 ml but the standard is really 180 ml.
How to keep it manageable
Do not try to count everything at once. Pick the 10 to 15 ingredients that make up most of your spending, usually protein, milk, coffee, cooking oil and rice. Count them weekly. Ask staff to record waste in a simple log. A variance of 2 to 3% is normal; anything above 5% deserves a closer look, ideally by outlet and by shift.
Tools, Costs and Honest Trade-offs
You have three realistic options:
- Spreadsheet: free and fine for one outlet with up to around 40 menu items. Downside: manual entry, easy to break formulas, hard to share across outlets.
- POS with an inventory and recipe module: many local POS systems offer this for roughly a few hundred thousand rupiah per outlet per month. Sales automatically deduct ingredients. Downside: limited for central kitchens, sub-recipes or custom reports.
- Custom system: suits multi-outlet chains or cloud kitchens with a central kitchen, transfers between outlets and specific approval flows. Typically a one-time investment in the tens of millions of rupiah, plus maintenance. Worth it when leakage across outlets is bigger than the build cost.
Be honest about one thing: no software fixes discipline. You still need digital scales, measuring jiggers, a fixed count schedule and someone who looks at the report and acts on it.
Your Next Step
Start small this week: build recipe cards for your 10 best-selling items, enter current purchase prices, and count your top 10 ingredients every week for two weeks. You will likely find at least one surprise. If you run several outlets or a central kitchen and want this connected to your POS and purchasing, talk to CodeWorks and we will help you map out what you actually need.